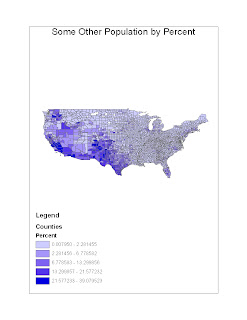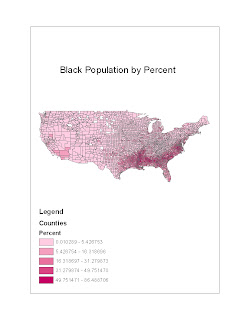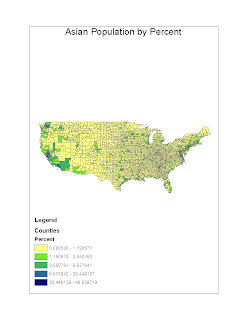


Each map illustrates the census data by county, while representing the spread of people who chose their race as either "Asian race", "Black race" or "Some other race" on the 2000 census, across the United States of America. The maps shows the percentage of the respected races per county. The maps illustrates the population distribution of the respective races. "Some other race" is considered to be a "non-standard" category in respect with the other race categories on the census. The "Black race" has the highest population percentage reaching roughly in the high 80%. This is a significant difference when compared with the other two maps. When viewing these maps, one can reflect on the different histories the races have had when comparing the population. There are probably different reasons why the "Black race" distribution has a larger volume than the "Asian race". It can go from hostorical, religious, or geographic reasons. None the less, it is interesting to observe the different maps.
I have had an extremely positive first impression on GIS. Its a brand new subject and captivated my interest. I enjoyed all the labs. Maybe at first it was fustrating because I did not know what I was doing at first, but with practice, I got a lot more comfortable and knowledgeable with it that kept me wanting more assignments. I now want to minor in GIS and hopefully find a job in the field, maybe DBMS. GIS is a powerful tool that can be used for many great purposes, from conventional to military. This class has helped me immensely in creating and observing GIS and I am grateful.